A great soul once said, 'It is not timing the market, but, time in the market that matters.' I will tactfully avoid any debate on the timing part and instead focus on how the concept of time in the market helps us to choose our investment.
This is most helpful when dealing with risk bearing investments such as equity or balanced mutual funds. Before making the investment, ask yourself, 'How long can I remain invested before I need the money back?' As this time period increases, the risk of losing decreases!
Generally an investment period of 5 years is recommended, in the least for equity investments. Suppose one invests when the markets are at a peak it is still possible to make good returns if the investor remains invested patiently.
If you had invested at the peak of IT boom in the year 2000 you could have still made a 16.5% returns after 5 years, i.e. year 2005. If you had continued to hold your investment till the end of 2006 you would have made 134% returns!
The returns earned here refer to the returns earned from investing in Nifty and if you consider an actively managed equity fund the returns were 466%%. This is not a one off event; similar returns have been experienced at different time periods.
Investments made in actively managed equity funds during the peaks before the equity market correction of 1994 and the correction after Asian currency crisis of 1997 have yielded 134% and 26% respectively.
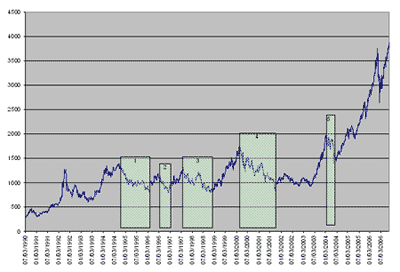
| Chart 1: Equity performance through time | |||||
|
Investment Periods |
Market Corrections | ||||
|
1 |
2 |
3 |
4 |
5 | |
|
Sep 94 to Jan 96 |
Jun 96 to Dec 96 |
Aug 97 to Nov 98 |
Feb 00 to Sep 01 |
Jan 04 to May 04 | |
|
Nifty (absolute returns) | |||||
|
3 Years |
-16.70% |
-0.80% |
1.40% |
-39.20% |
NA |
|
5 Years |
-1.00% |
-9.00% |
-25.50% |
16.50% |
NA |
|
Peak to trough returns |
-41.20% |
-32.20% |
-37.30% |
-51.30% |
-29.90% |
|
Till date |
196.70% | 246.60% | 217.80% | 134.30% | 107.30% |
|
|
Actively managed large-cap fund (absolute returns) | ||||
|
3 Years |
-26.10% |
58.40% |
48.10% |
-61.40% |
NA |
|
5 Years |
133.54% |
70.05% |
25.45% |
334.74% |
NA |
|
Peak to trough returns |
-24.50% |
-29.10% |
17.30% |
-75.70% |
-23.00% |
|
Till date |
847.70% |
407.90% |
523.00% |
466.40% |
NA |
Don't panic and sell when markets fall
Five of the worst falls since 1990 were examined. The point to be noted here is that even if one had invested at the peak, and held on through the fall, he would have made positive gains. Panicking and selling in the fall would have resulted in a loss as mentioned in the 'Peak-to-trough' returns.
For example an investor would have lost 52% on Nifty in the year 2000's technology led correction; similarly the peak to trough Nifty returns in market correction in 1997 was 37% and 41% during 1994.
Patiently holding on for at least 5 years, ended with gain, in spite of having invested at the peak. It can be observed that the three-year performance is not satisfactory always.
Chart 2 : NAV movement of a diversified large cap equity fund from 1990 to 2006
Do not venture into equity for shorter period if you cannot take the risk of losing money
Here, I would like to draw a distinction between the index and an actively managed fund. The idea, of being invested in a good well-diversified equity fund with a long track record of success, is that it would most likely outperform the index due to its ability to select the right equities instead of relying on a general trend.
In this example, too, the fund has managed to beat the index. By choosing the right time horizon for your investments and then matching it with the right investment is crucial to making appropriate gains. If one does not want to take the risk of losing, then he should not venture to invest in equity for shorter periods.
Instead he could look at bond funds or hybrids with low equity exposures. And of course, a systematic investment plan removes a good amount of uncertainty from the process.
The author is Managing Director, Hexagon Capital Advisors Pvt. Ltd. He can be reached at bhagavat@hexagononline.com.


More from rediff