The reforms over the past ten months -- be it notification for the FRBM Act, approval for VAT, widening of tax base or phased withdrawal of tax exemptions -- were all indicative of the government's initiative to curb deficits (revenue and fiscal).
However, the economic survey released today contradicts this notion. Despite projections of a 6.9% growth in GDP for 2005-06, the economic survey 2004-05 fails to substantiate as how and when the government will garner resources to meet the requisite expenditure budgets.
As against 9mFY04 (April-December 2003), when the revenues garnered were 108% of the budgeted figures, in 9mFY05 they have fallen short to the extent of 22%.
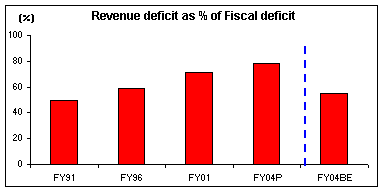
While the budgeted estimates for revenue deficit (as a % of fiscal deficit) have drastically fallen to 55% as against 78% (FY04-Provisional) the same does not seem to be feasible in the current scenario.
However, the fiscal deficit figures are expected to continue the declining (improving) trend and account for 4.4% of GDP as against 4.6% last year.
Revenue came from. . .
Lower receipts. . .
| Rs bn | 2004-05BE | 9mFY04 | 9mFY05 | % change | % of budgeted for 2005 |
| Total Revenue Receipts | 3,093 | 1,705 | 1,884 | 10.5% | 60.9% |
| -Tax Revenues | 2339 | 1,188 | 1,412 | 18.9% | 60.4% |
| -Non Tax Revenues | 754 | 517 | 472 | -8.7% | 62.6% |
| Total Capital Receipts | 1,685 | 1,458 | 1,383 | -5.1% | 82.1% |
| -Recovery of loans | 271 | 519 | 452 | -12.9% | 166.8% |
| -Other receipts | 40 | 15 | 29 | 93.3% | 72.5% |
| -Borrowings | 1374 | 924 | 902 | -2.4% | 65.6% |
| Total Receipts | 4,778 | 3,163 | 3,267 | 3.3% | 68.4% |
Rising interest payments, expenditure on subsidies, pay and allowances, and pensions coupled with a near stagnant tax-GDP ratio (30% at present) have mainly contributed to the worsening of the revenue deficit. While the revenue receipts swelled by 11%, the capital receipts witnessed a decline of 5% over the previous year. But what is heartening is to note that the non-debt receipts are higher than the FRBM benchmark of 40% of the budgeted estimates. Revenue realised from corporate income tax, excise and service tax during 9mFY05 as a % of what was budgeted, was lower as compared to the realisations in the corresponding period last year despite strong 9 month results posted by India Inc. Non tax revenue during the same period declined by 8.7% mainly reflecting lower interest and dividend receipts.
Revenue spent on. . .
And lower outlay. . .
| Rs bn | 2004-05BE | 9mFY04 | 9mFY05 | % change | % of budgeted for 2005 |
| Non Plan Expenditure | 3,322 | 2,396 | 2,456 | 2.5% | 73.9% |
| a) Revenue Account | 2,937 | 1,945 | 1,982 | 1.9% | 67.5% |
| -Interest Payment | 1,295 | 785 | 799 | 1.8% | 61.7% |
| -Major Subsidies | 420 | 375 | 323 | -13.9% | 76.9% |
| -Pensions | 159 | 106 | 125 | 17.9% | 78.6% |
| -Others | 1,063 | 679 | 735 | 8.2% | 69.1% |
| b) Capital Account | 385 | 451 | 474 | 5.1% | 123.1% |
| Plan Expenditure | 1,455 | 766 | 812 | 6.0% | 55.8% |
| a) Revenue Account | 918 | 490 | 532 | 8.6% | 58.0% |
| b) Capital Account | 537 | 276 | 280 | 1.4% | 52.1% |
| Total Expenditure | 4,777 | 3,162 | 3,268 | 3.4% | 68.4% |
A welcome change on the expenditure side is the low escalation in non-plan expenditure as to that of the previous years. This can be attributed to the lowering of subsidies, which fell by 14% and lower interest cost due to the falling interest rate regime witnessed during the first 9 months of FY05. The lower growth in non-plan expenditure on capital account was due to lower redemption of securities issued to NSSF and the proceeds being used for the prepayment of high cost debt by states under the debt swap scheme. On the other hand, lower growth in plan expenditure, both revenue and capital, was on account of the delay in the allocation of additional outlay of Rs 100 bn, due to the presentation of budget in July 2004 as against February 2004.
Targeting FRBM requirements. . .
While the focus remains on curbing the fiscal deficit, which should be eliminated by FY08, as per the FRBM Act, the means for doing the same do not seem to be sustainable. Although the budgeted estimates for fiscal deficit (as a % of GDP) have reduced by 20 basis points to 4.4% from 4.6%, the deficit financing has been mainly through the recovery of loans (on the capital side) and non tax revenues (on the revenue side), both of which hold no certainty in future.
Outlook
The government's inability to meet the budgeted targets for garnering revenues accentuates the fact that besides extending the tax base and tapping potential taxpayers, the government should also focus on timely 'collection' of the same so that the budgeted outlays are not delayed. This is not only necessary for achieving our GDP targets but also to offer tax sops to the requisite areas.
Historical public sector outlay
| (Rs bn) | Agriculture | Rural devpmt | Energy | Industries | Transport | Education* | Health # |
| 1985-86 | 18.2 | 26.7 | 96.8 | 49.1 | 40.7 | 8.7 | 5.8 |
| 1992-93 | 42.1 | 63.7 | 20.2 | 64.4 | 106.6 | 28.8 | 12.1 |
| 1998-99 | 76.9 | 121.6 | 355.7 | 79.7 | 203.4 | 96.8 | 155.7 |
| 2001-02 | 85.4 | 146.7 | 433.2 | 95.7 | 416.9 | 131.4 | 162.5 |
| 2002-03 | 37.3 | 64.2 | 363.1 | 79.9 | 320.4 | 69.1 | 84.1 |
* includes sports, art and culture
# includes water supply and sanitation
The historical figures for public sector outlays outline the fact that the government has shifted focus to education and health expenditure over the last few years. A timely collection and dispensation of the revenues in the said areas will definitely augur well for the country's economic targets.

This is part of Equitymaster's Budget 2005-06 series. Equitymaster.com is one of India's premier finance portals. The Web site offers a user-friendly portfolio tracker, a weekly buy/sell recommendation service and research reports on India's top companies.


 © 2025